3.1
To understand the nature of bail decision making in the trial courts, it is essential to first develop a broader account of crime, arrests and under trial detention in India, and more particularly, in Karnataka. In Chapter I, we briefly reviewed the public concern with under trial detention in India. In this Chapter, we examine the scope and extent of the problem of under trial detention in India in greater detail. We analyse data on crime, arrest and under-trials in the State of Karnataka to provide background context for the study on bail decision making in lower courts in Karnataka, reported in Chapters V and VI of this Report.
3.2
The NCRB releases two annual reports titled ‘Crime in India’ and ‘Prison Statistics’. These reports are the primary source of data on the criminal justice and prison system at a national scale. The Prison Statistics for 2015 show that although 84,93,826 persons were arrested for offences under Indian Penal Code, 1860 (IPC) and Special and Local Laws (SLLs), only 4,19,623 persons were in prison at the end of the year.[1] Of those detained, 2,82,076 were ‘under-trial’ prisoners, constituting 67.2% of the total prison population.[2] In 2016 as well, the proportion of under-trial prisoners remained the same, even though fewer arrests were made during the year.[3] In other words, 2 out of every 3 people detained in India at the end of 2016 have not been convicted of any offence. In fact, for many of these detainees, the trial is yet to begin. However, the NCRB Report does not separately identify the number of prisoners whose trial is yet to commence.
3.3
Therefore, while the overall incarceration rate at 33 per 100,000 persons[4] in India is not alarming, the ‘under-trial’ incarceration rate at 22 per 100,000 persons[5] is high and deserves closer attention.
With this broader context at the national level we now turn to analyse the Karnataka data in greater detail.
A. Karnataka – An Overview Of Crime And Arrests
3.4
With a population of 6.11 crores,[6][7] Karnataka is the 8th most populous State in India and the 7th largest by land area. As of January 2016, the investigative leg of its criminal justice system comprises 114.15 police personnel per lakh population against a sanctioned strength of 177.36, which is substantially lesser than the national average of 180.597. The criminal court system includes district trial courts (Judicial Magistrates and Civil Judges), Sessions Courts and the High Court. Judicial Magistrates have jurisdiction over criminal offences which are punishable with imprisonment of up to five years. Sessions Judges who preside in the Sessions Courts, have the power to try criminal offences punishable with imprisonment above five years up to the death penalty.[8]
3.5
Karnataka has 8 central jails and 19 district jails, with a capacity of 13,759 persons. However, prisons in Karnataka are running over their full capacity and as of 2016, 107.9% of the total capacity of prisons in the State was occupied.[9]
3.6
As per the NCRB data, in 2016, around 71% of the prison population in Karnataka were under-trial prisoners. The NCRB adopts the census method to account for the prison population. Hence, while we know the number of prisoners at the end of the year, we have no estimate of the prisoners who were detained in the prison at some point during the year.
3.7
Further in the Prison Statistics, 2016, the NCRB has excluded any analysis of prisoners on the basis of their caste and religion, unlike the prison statistics of the previous years, and without offering any explanation for this change.[10] Therefore, in order to ensure to ensure consistency in comparison across different themes, we study and analyse data on prison statistics in Karnataka between 2010-2015.
3.8
In Figures b and c, we compare the number of under-trial prisoners in Karnataka at the end of the year with the number released on bail in each year.
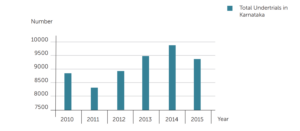
Figure b: under-trial Prisoners in Karnataka (2010 – 2015)
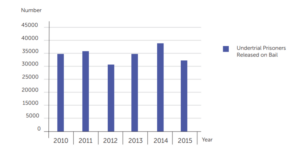
Figure c: Details of under-trials released on bail in Karnataka (2010-2015)[11]
3.9
While the total number of under-trial prisoners released on bail in 2015 is marginally lower than in the previous years, 2014 boasts of the highest numbers of detenues released in the last 6 years. Hence, no clear trend is discernible. Significantly, the under trial population in Karnataka has steadily increased between 2012 and 2014 but drops in 2015. So, there appears to be no direct relationship between the overall under trial population and the number of detenues released on bail.
3.10
More significantly, we must explain why the number of prisoners released on bail is nearly four times that of the under trial population. As the NCRB report adopts a census method, the number of under trial prisoners recorded by the reports only provides a sense of the ‘stock’ of detenues in the prison system at a given point in time and not the ‘flow’ i.e. the number of persons who are arrested and subsequently released in the year.
3.11
Though we have no available data on the overall flow of under trial detenues in any year, from the NCRB Prison Statistics 2015, we can analyse (I) the demographic profile of detainees in Karnataka, (II) the offences for which they have been detained and (III) variations in reporting of crime across the State, if any.
I. DEMOGRAPHIC PROFILE OF UNDER-TRIAL PRISONERS
3.12
In Karnataka, nearly 80% of undertrial prisoners at the end of 2015 had never secured a high school education. Further, more than 30% were illiterate, which is to be seen in light of Karnataka’s reasonably high literacy rate of 75.36%.[12]
Hence, it appears that educationally disadvantaged persons are particularly vulnerable to incarceration. We were unable to determine whether this demographic bias against educationally backward persons takes place at the stage of arrest, during bail decision-making or in the system of probation and parole, as we do not have similar demographic data on those arrested.
3.13
A substantial 82% of under trial prisoners in Karnataka are Hindu. With religious minorities such as Muslims and Christians, the number of under trial prisoners coincided with the proportion of Muslim and Christian population in Karnataka.
3.14
SCs and STs constituted about 18% of the under trial population in Karnataka, while the general category constituted almost 80% of the under trial population. As census data on the OBC population and general category was unavailable, we were unable to compare the proportion of under trials in each caste category with the caste category as a proportion of the total population of Karnataka.
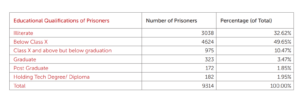
Table 3: Education profile of under-trial prisoners in Karnataka in 2015[13]
| Religion | Karnataka Population As Per Census 2011[14] |
Number Of Under Trials[15] |
% Out Of Total Under Trials |
% Of Census Category To Karnataka Population |
Ratio Of Under Trials To Total Karnataka Population Per 100,000 Population |
| Hindu | 5,13,20,049 | 7,647 | 82.10 | 83.99 | 12.21 |
| Muslims | 78,93,512 | 1,333 | 14.31 | 12.92 | 2.18 |
| Sikhs | 30,548 | 6 | 0.06 | 0.05 | 0.0098 |
| Christians | 11,42,482 | 308 | 3.31 | 1.87 | 0.50 |
| Others (includes “not disclosed” for the census data) |
7,14,815 | 20 | 0.21 | 1.17 | 0.033 |
| Total | 6,10,95,297 | 9,314 | 99.99% | 100% |
Table 4: Religious profile of under trial prisoners in Karnataka in 2015
| Religion | Karnataka Population As Per Census 2011[16] |
Number Of Under Trials[17] |
% Out Of Total Under Trials |
% Of Census Category To Karnataka Population |
Ratio Of Under Trials To Total Karnataka Population Per 100,000 Population |
| SC | 1,04,74,992 | 933 | 10.02 | 17.15 | 1.53 |
| ST | 42,48,987 | 696 | 7.47 | 6.95 | 1.14 |
| OBS | NA[18] | 344 | 3.69 | NA | 0.56 |
| Others (General) | NA[19] | 7341 | 78.82 | NA | 12.02 |
| Total | 6,10,95,297 | 9,314 | 100% |
Table 5: Caste profile of under trial prisoners in Karnataka in 2015
II. NATURE OF OFFENCES
3.15
In this section, we develop a broader account of the levels of reported crime and arrests made in Karnataka in recent years based on data collated from the Crime in India Reports of the National Crime Records Bureau between 2010 and 2015. As we observe later in this report, the type of crime has a significant impact on the level of under trial detention and hence this is essential background for this study.
3.16
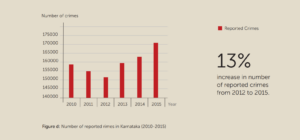
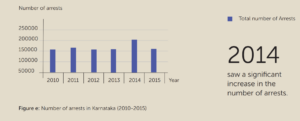
While overall number of reported crime decreased marginally from 2010 to 2012, it has increased by nearly 13% from 2012 to 2015. In the same period, the number of arrests has remained relatively stable at about 150,000 a year. In 2014, there was a significant increase in arrest though the reported crimes were lower than in 2015. This elementary analysis makes it clear that the levels of arrest do not closely follow the levels of reported crime.
3.17
We may be able to explain some part of this gap between the levels of reported crime and arrests by focusing on the significant variations in the rates of arrest across categories of offences.
3.18
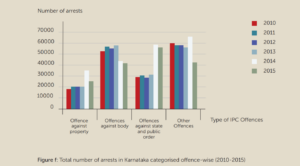
Under the IPC, crimes are organized[20] into categories such as offences against property, offences against the body, offences against the state and public order and other offences. Figure f shows that the number of arrests are higher in 2014 for offences against the state and public order and other offences. As a result, the number of total arrests spiked in that year, as we can see from figure. More generally, fewer people are arrested for offences against property while far higher numbers are arrested for offences against the body and other offences.
3.19
Hence, the type of offences recorded in the FIR or the charge sheet has a significant bearing on the likelihood of arrest in the criminal justice system.
III. VARIATION WITHIN THE STATE
3.20
In this study, we exploit the variations across districts within the State of Karnataka to aid our inquiry into bail decision making in the courts in three districts – Bengaluru Urban, Tumakuru and Dharwad which represent varying levels of crime and urbanisation.
3.21
Bengaluru (which includes the urban and rural parts) has only 3 jails, including 1 Bengaluru Rural jail, despite being the fifth most populous urban area in India.[21] Significantly, Dharwad and Tumakuru have 5 and 4 jails respectively, which includes one Central jail in each city. Tumakuru has the only Women’s Central jail in Karnataka.
3.22
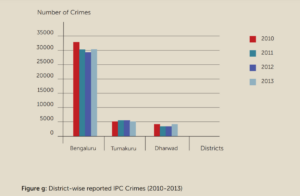
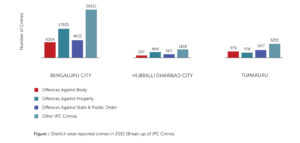
Among the three districts, Bengaluru reported the highest number of offences under the IPC. Dharwad reported the lowest number of cases among the three districts i.e. less than 8% than Bengaluru while reported offences in Tumakuru were around 13% of those in Bengaluru (Figure g).
3.23
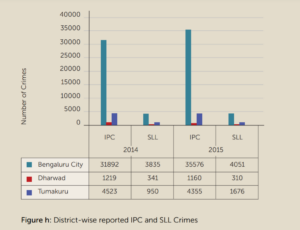
In the last two years, Bengaluru and Tumakuru have seen an increase in offences under SLLs, unlike Dharwad, while only Bengaluru reported a substantial increase in IPC offences.
3.24
When we breakdown the crimes reported in each district, the differences are more obvious. In Bengaluru, other IPC crimes are almost equal to offences against the body, property and State combined. In Bengaluru and Dharwad, offences against property were the next most common offence, while in Tumakuru, it was offences against the body. As we noted earlier, arrests have been made at lower rates for offences against property, which could have an effect on levels of under-trial detention in Bengaluru and Dharwad (Figure h).
3.25
Thus, there is significant variation in crime and under-trial numbers across districts in Karnataka, which led us to identify three different sites for this study – Bengaluru, Tumakuru and Dharwad.
Conclusion
3.26
The NCRB Reports on Crime in India and Prison Statistics does not record any data on bail decision making in India. Hence, in this Chapter, we develop a quantitative baseline on the number and nature of arrests as well as the levels of detention in India, and more particularly in Karnataka. We noted that while incarceration rates in India are relatively low by international standards, the census method of prison survey understands detention rates to be nearly a quarter of all detention in a year.
3.27
A closer analysis of the Karnataka data suggests that like the rest of India, a majority of detenues in Karnataka are under trials. Further, an overwhelming majority of detenues are from socially and educationally backward sections of society. However, there appears to be little correlation between the levels of reported offences and arrests in any given year. Some part of this variation may be explained by the differential rates of arrest for different offences under the IPC, with higher rates of offences against the body, offences against the State and other offences.
3.28
We conclude the Chapter by investigating variations within the various districts of Karnataka. We focus on three districts namely Bengaluru, Dharwad and Tumakuru, which are three urban and semi-urban districts that show significant levels of reported crimes in the State. Before we turn to our empirical study of bail decision making in courts in Chapter 5, we review the legal framework that governs arrest and bail in India with an emphasis on recent legal reform in Chapter 4.
References
- ‘Prison Statistics 2015’ (National Crime Records Bureau, Ministry of Home Affairs, India <http://ncrb.nic.in/> accessed 20 September 2019. ↵
- ibid. ↵
- In 2016, out of 61,30,507 persons arrested, 4,18,536 persons were in prison at the end of the year. See ‘Crime in India, 2016’ (National Crime Records Bureau, Ministry of Home Affairs, India <http://ncrb.gov.in/StatPublications/CII/CII2016/pdfs/NEWPDFs/ Crime%20in%20India%20%2020%20Complete%20PDF%20291117.pdf> accessed 23 November 2019; ‘Prison Statistics 2016’ (National Crime Records Bureau, Ministry of Home Affairs, India) <http://ncrb.nic.in/> accessed 20 September 2019. ↵
- World Prisons Brief (International Centre for Prison Studies <http://www.prisonstudies.org/country/india> accessed 23 November 2019. ↵
- ibid. ↵
- Census, 2011 <http://www.censusindia.gov.in/2011census/PCA/PCA_Highlights/pca_highlights_file/India/Chapter-1.pdf> accessed 23 November 2019. ↵
- ‘Data on Police Organisations (Bureau of Police Research & Development, 2016)<http://bprd.nic.in/WriteReadData/userfiles/file/201701090303068737739DATABOOK2016FINALSMALL09-01-2017.pdf> accessed 23 November 2019. ↵
- A Brief History of City Civil Court, Bengaluru (Karnataka Judiciary) <http://ecourts.gov.in/bangalore> accessed 23 November 2019. ↵
- ‘Prison Statistics 2016’ (National Crime Records Bureau, Ministry of Home Affairs, India)<http://ncrb.nic.in/> accessed 20 September 2019. ↵
- Dilip Mandal, ‘Another data mishap? NCRB’s new prisons report has no caste, religion breakdown of inmates’ (The Print, April 4, 2019) <https://theprint.in/opinion/another-data-mishap-ncrbsnew prisons-report-has-no-caste-religion-breakdown-of-inmates/216604/> accessed 18 April 2019. ↵
- ibid. ↵
- Census, 2011 <http://www.censusindia.gov.in/2011census/PCA/PCA_Highlights/pca_highlights_file/India/Chapter-1.pdf> accessed 23 November 2019. ↵
- ‘Prison Statistics 2015’ (National Crime Records Bureau, Ministry of Home Affairs, India) <http://ncrb.nic.in/> accessed 20 September 2019. ↵
- Census, 2011 <http://www.censusindia.gov.in/2011census/PCA/PCA_Highlights/pca_highlights_file/India/Chapter-1.pdf> accessed 23 November 2019. ↵
- ‘Prison Statistics 2015’ (National Crime Records Bureau, Ministry of Home Affairs, India) <http://ncrb.nic.in/> accessed 20 September 2019. ↵
- Census, 2011 <http://www.censusindia.gov.in/2011census/PCA/PCA_Highlights/pca_highlights_file/India/Chapter-1.pdf> accessed 23 November 2019. ↵
- ‘Prison Statistics 2015’ (National Crime Records Bureau, Ministry of Home Affairs, India)<http://ncrb.nic.in/> accessed 20 September 2019. ↵
- Data not available. ↵
- Data not available. ↵
- Categorisation of Offences – a) Offences Against Body: Murder, Attempt to commit Murder, Culpable Homicide not amounting to Murder, Attempt to commit Culpable Homicide, Rape, Attempt to commit Rape, Kidnapping & Abduction, Grievous Hurt, Dowry Deaths, Assault on Women with intent to outrage her Modesty, Insult to the Modesty of Women, Cruelty by Husband or his Relatives, Importation of Girls from Foreign Country, Causing Death by Negligence, Human Trafficking and Unnatural Offence. From 2014, the following offences were added to this category. b) Offences Against Property: Dacoity, Making Preparation and Assembly for committing Dacoity, Robbery, Criminal Trespass/Burglary, Theft, Criminal Breach of Trust, Cheating, Forgery, Counterfeiting, Arson and Extortion. From 2014, the following offences were added to this category. c) Offences Against State and Public Order: Riots. From 2014, the following offences were added to this category - Offences against State, Unlawful Assembly, Offences promoting enmity between different groups, Disclosure of Identity of Victims and Incidence of Rash Driving. d) Other IPC Crimes: The NCRB data does not give a definition of what this category contains. ↵
- INDIA STATS: Million plus cities in India as per Census 2011 (Press Information Bureau, National Informatics Centre) <http://pibmumbai.gov.in/scripts/detail.asp?releaseId=E2011IS3> accessed 23 November 2019. ↵